
Note: I originally wrote this post back in 2017 during my time at Context Information Security. It gained a second life in 2021 when Mubix (Rob Fuller) featured it in a Hak5 video, which prompted me to update the content. Now that the original site is archived, I have migrated the post here - with some minor formatting cleanups - to consolidate my work in one place. You can view the original archive here.
When you’re trying to move swiftly, recording what you’re doing can be a bit of a drag – this post will cover semi-automating it, freeing you up to focus on the good stuff.
Why Bother
First of all, why might we want to do it in the first place? Here are a few reasons.
Reporting
Logs can be a helpful reference when reporting after a test to remember what order you did something in, or for extracting exact command snippets to add into a report.
Accountability
If your client’s SOC detects an attack during the engagement, you can quickly verify whether it was you, or someone else e.g. your friendly neighbourhood nation-state (and we have encountered this on a couple of engagements!).
Similarly, if your client’s server goes down during the test, it can be easy to blame the pen-testers. Just because you were blasting packets at the time, it doesn’t necessarily mean it was you that torched the friendly neighbourhood Windows 2000 box. Your logs can help verify this.
Recreating
A fellow tester on a re-test of your engagement, or QA-ing your work, wants to piece together how exactly you tested it the first time. With your detailed notes and logs they can do this independently. The same may be true if the client wishes to recreate.
Contractual
It may be a contractual requirement to provide your test logs and data to a client for audit purposes. This is certainly the case on CBEST Red teaming engagements. It would be very difficult and time consuming to recreate these from scratch, if logging was not enabled from the start.
Thought process
It’s considered good practice to note down your epic-hack ideas and observations during the test, even if they seem like nothing at the time. These notes can be handy when revisiting your attack path, especially when you hit the wall and you feel like you’re out of ideas. Alternatively, your fellow testers could go through your attack path and may recommend a new vector you hadn’t considered.
Key Info to Capture
There are multiple ways to record data automatically, which we’ll explore later in this post. But first, we must identify valid information to be captured.
Unique identifiers
Identifiers can differentiate you from other machines on a client’s network. For example, ifconfig/ipconfig output. Yes, you could argue that IP and MAC info are not truly unique; but if recorded with the current date and time then that will reduce the randomness.
Also, it is a good idea to uniquely identify the targets where possible. For example, firmware versions of routers, App build version identifiers.
Timeline
Record date and time of key actions performed/occurred relating to the overall project. For example, when you: were collected from reception; received connection details; first connected to the network; executed certain commands and in what order, etc.
By the way, in Onenote you can quickly insert a time/date stamp using ALT+SHIFT+F, or in CherryTree with CTRL+ALT+M.
Visuals
A picture says a thousand words. You might want to capture screenshots of the App, RDP login or other visuals that don’t capture well as text. This can really help jog your memory when revisiting an engagement. For example, when a client requires clarification weeks, months or a year later, visuals can help prove that a certain version of the App looked a certain when tested.
I generally use Onenote’s WINDOWSKEY+S screen clipping function for this, although recently I’ve started using Greenshot, which makes it a breeze to rapidly screenshot a particular screen region e.g. when moving through a Web App, and save directly to a file auto-named with timestamp and browser window name.
Sometimes a video or screencast is the most efficient way of capturing and demonstrating an end-to-end attack path. Also makes great footage which can be distributed internally amongst peers.
Humans
It’s also a good idea to capture non-technical/project details relating to the overall engagement. For example, key personnel involved, contact details, location, meeting minutes, requests or deviations from scope and the time they were agreed.
Now let’s look at how best to configure our systems and various tools-of-the-trade in order to log like a lumberjack.
Linux-based Systems
Time-Stamping on your Terminal
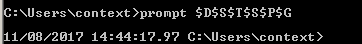
Configure the terminal prompt to include a time and date stamp.
Edit your.bashrc file:
|
|
Edit your PS1 variable to:
|
|
Then it will look like:
|
|
Additional tweaks you might like to use include:
- Current IP address
- Handy, so later you can say ‘at this time, my IP was ‘,
- and also for copy-pasting into a tool for a reverse connect
- Show current folder name only
- Rather than a full directory path than an absolute path - to keep the prompt shorter and still useful.
To do this, edit your PS1 to:
|
|
Alternatively, if your ifconfig output uses colons:
|
|
Substitute ’eth1’ for your favourite NIC.
Then your prompt will look something like [when in /usr/bin/ directory]:
|
|
Doing this has the handy side effect of capturing your IP at the time/date a command was run at when you paste a snippet into your testing notes.
Now that we’ve tied together ‘when who did what from where’, we’ll automatically record it to scale up the handiness.
ip instead of ifconfig (January 2021 update)
After seeing Hak5 Mubix’s great walk-through video on logging I realised my blog post could do with an update.
The following snippet will make use of the more modern ‘ip’ command rather than ‘ifconfig’, and - IF you have a default route; get the IP address of the interface using it, ELSE find the interface with the fastest speed and use that IP address:
|
|
RESULT
|
|
Where:
- ‘t:’ = first letter of default interface e.g. tap/tun, ‘w:’ for wlan etc
- ‘git’ = the current directory
Massive thanks to Si Clow for his Bash-fu wisdom here!
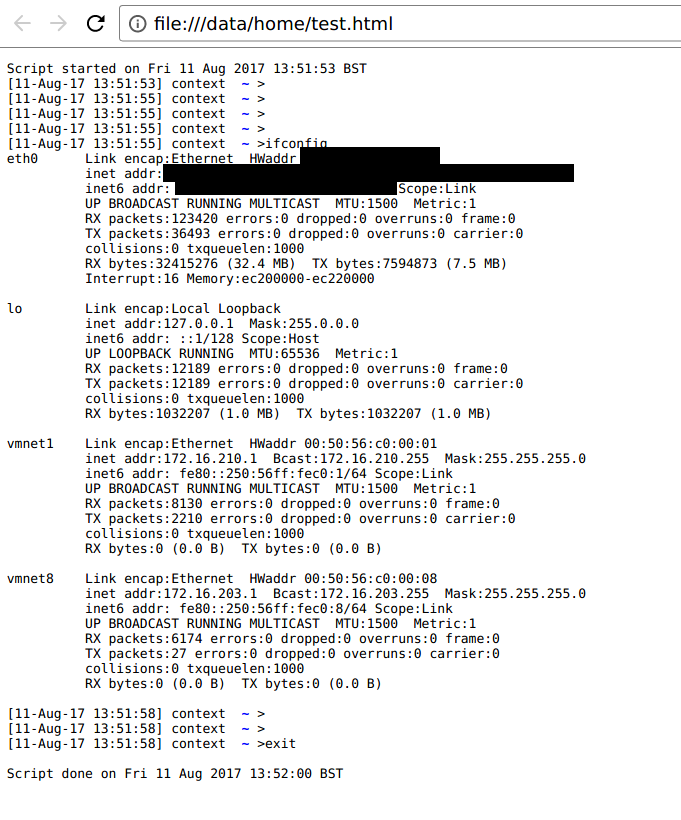
Chronicling Your Commands with Script
There are a couple of options here. You could use the ‘script’ tool from bsdutils:
|
|
To automatically create a new log file each time you start a new terminal, add this to your.bashrc:
|
|
Starting a new terminal, you’ll get a message like this:
|
|
Script will capture all keypresses and terminal colour codes, so when cat-ing the log file later it will appear exactly the same as when you recorded – colour-coding an all.
The downside is that it looks like barf when you view the log in a text editor..
|
|
This is not very copy-paste-reporting friendly, so you’ll need to ‘cat’ it to your terminal before you copy-paste it.
Or, pipe it through ‘aha’ to produce a nice looking HTML version of your log, complete with colour coding:
|
|
Result:
GNU Screen
This is my preferred way of logging terminal output.
Screen is a full-screen window manager that multiplexes a physical terminal between several processes, typically interactive shells. It’s particularly handy when SSH’d into a server for leaving commands running when you (intentionally or unintentionally!) disconnect.
You can enable terminal logging with CTRL+A,H. It will automatically be saved to a file named screenlog.X (where X is a number) in the directory you launched your terminal from.
You can configure Screen to auto-log for each new window started, by adding the “deflog on” to your screenrc file.
More details can be found here: https://www.gnu.org/software/screen/manual/screen.html#Logging
Metasploit
Personalise that Prompt
In Metasploit, you can add extra info to your prompt with the following command:
|
|
Where:
%S = number of active shell sessions.
%J = number of active background jobs.
%L= IP address
%T=Time/date
To make it look like:
|
|
The above example shows that, “I got 99 sessions but a job ain’t one”.
To auto-set the prompt each time Metasploit loads, just add the set prompt command into ~/.msf4/msfconsole.rc. You’ll need to create this file if it does not exist already.
Chronicling Commands with Spool
Metasploit’s (MSF) Spool function is similar to Script for the terminal. Spool will only record actions within MSF, so it’s good if you want a dedicated MSF log, rather than carving it out of your Script log file later.
To enable spool, run spool :
|
|
To disable spool, run spool off
|
|
Note that, if you’re already running a ‘Script’ log in the parent terminal, then all your MSF actions will be automatically captured.
Exporting History
To export the command history for your current MSF session, run makerc:
|
|
Commands.rc looks like:
|
|
As you can see, this lists only the commands – no module output.
This can be handy for extracting the list of commands you used to load and configure a Metasploit module. Which you can stick in an.rc file, and load into Metasploit either on start like this:
|
|
or, ‘in-flight’ like this:
|
|
Windows-based
Cmd.exe
Add a timestamp to cmd.exe with the following command:
|
|
To make it look like:
PowerShell (January 2021 update)
Add a timestamp to powershell.exe with the following command:
|
|
To automatically apply the prompt customisation on each new session, add the command to your PowerShell profile (create it if it doesn’t exist):
- Result: C:\Users\Documents\WindowsPowerShell\Microsoft.PowerShell_profile.ps1
|
|
PuTTY
PuTTY is a free SSH and Telnet client for Windows and Unix platforms. If you’re accessing servers via SSH from Windows, then this is a pretty common tool to use.
To configure logging of your session, see the Session>Logging menu:
- Set ‘Session Logging’ to ‘Printable output’.
- ‘Always append to end of an already existing log file’
- Set ‘Log file name’ to ‘&Y&M&D_%T_ _putty.log’ (or, whatever you like).
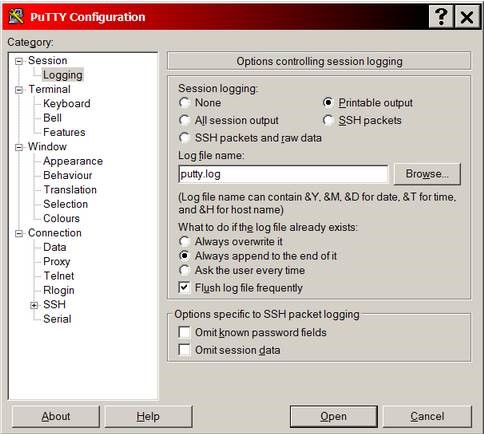
Pro-Tip: This can be handy when manually dumping a plain text Cisco config.
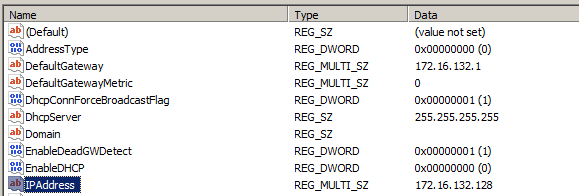
Registry Recover Recent IP
Perhaps you’ve already disconnected from your target network and forgot to note down your IP? Good news! You might be able to grab it from the registry (if you haven’t connected to a new network yet).
Pop open regedit.exe (or cmd line alternative) and browse to:
|
|
Multi-platform
Wireshark
Wireshark is a packet capture and protocol analysis tool. You could run it on the interface you’re testing to record all your traffic during a test. Beware, PCAPs can get big really fast.
In the interests of not using up all your hard drive space, we can use capture filters to trim the traffic to only the hosts in scope.
For example, if you were doing a web application test, then you could use the following filter to only capture traffic between your source IP, the destination IP in scope, and on port 80:
|
|
Something to keep in mind is Wireshark, by default, doesn’t auto-save as you’re going along. So if it crashes you might lose the whole capture.
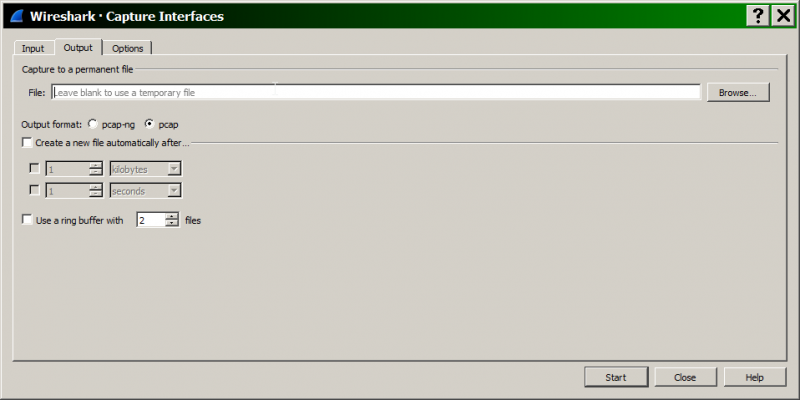
To protect against this, you can configure a permanent file to log to, under capture interfaces>Output:
You can also configure a ring buffer of files split by size and/or time. More info here:
https://www.wireshark.org/docs/wsug_html_chunked/ChCapCaptureFiles.html
Git
Git is a version control system for tracking changes in computer files and coordinating work on those files among multiple people.
How can it help us during an engagement?
- Keeping ‘checkpoints’ of your test data that can be restored to when, for example, Word eats your homework. Or when you delete a database of scrape data that you just spent a day collecting… ahem.
- Collaborating with colleagues on the same test e.g. making edits to the same report
- Logging – commits are timestamped. If commits are done every minute then you’re effectively logging changes to all files in your repo/engagement folder at once!
Local Repo
Create a local git repo for current test, called ‘pentest’:
|
|
Now it’s ready to store files and stuff.
Auto-committing
First of all, cheers to Simon Clow for this idea.
Create a script, /data/Engagement/pentest/gitcommit.sh, to commit the changes to your repo:
|
|
Ensure it has permissions to run:
|
|
Create crontab entry to run the script on a schedule (every minute in this case):
|
|
Contents:
|
|
Manual Logging
Now that we’ve covered our bases with the automatic logging, a final point on keeping a hand-written/typed log of key events that happen outside of the computer.
Last year a colleague and I were on a job where we couldn’t start our test until more than half way through the 1st day, which meant there wouldn’t be enough time to fully test everything originally agreed. We raised this with the client so that everyone was on the same page.
A couple of weeks later, there was a dispute about why XYZ wasn’t tested, followed by a rather imaginary timeline. Thanks to manual logs of who said what and when, we were able resolve the dispute very quickly and accurately.
Hope that you enjoyed this post and that it will help you in the field.